England Real House Prices Decline: Inflation Impact, Regional Shifts, And 2026 Outlook
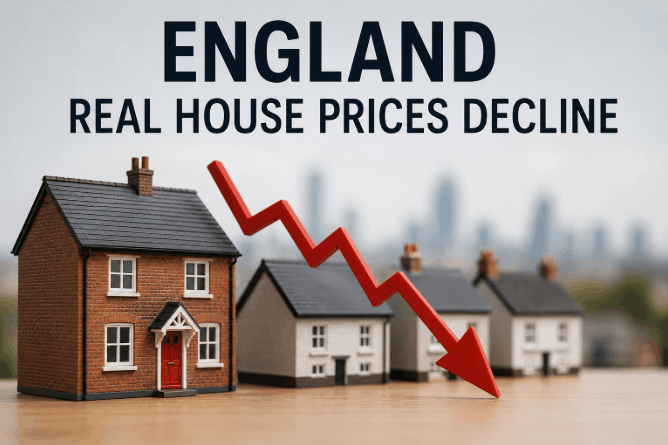
A rising average price usually suggests that a market has recovered. But England’s housing market tells a different story once inflation is taken into account: real house prices have fallen by £47,522 since the market’s most recent peak in June 2021, even though average prices are still edging upwards.
The gap between the headline figure and what a home is actually worth in today’s money is at the heart of the England real house prices decline. It also explains why homeowners can feel reassured by one set of figures but disappointed by another.
How much have real house prices in England fallen since 2021?
Real house prices in England have dropped by £47,522 since June 2021, once the figures are adjusted for inflation. That figure, based on an analysis of official house price data, shows how far property values have fallen in real terms even though nominal prices have held up.
The picture changes depending on what prices are being compared. Measured against prices from 20 years ago, homes in England are still worth considerably more in cash terms. But measured against the 2021 peak, and adjusted for everything inflation has eaten away since, the picture flips.
Paul Cheshire, emeritus professor at the London School of Economics, has pointed to weak wage growth as one of the underlying drags on the market, noting that incomes have simply not kept pace with the cost of living in the years since the 2008 financial crisis.
Higher mortgage rates add to the pressure. They reduce what buyers can afford, limiting how far sellers can push their asking prices and making it harder for nominal prices to stay ahead of inflation.
This is not easy to see from a single monthly index reading. It becomes clearer when today’s prices are compared directly with the 2021 peak and adjusted for the loss in purchasing power since then.
Why are house prices falling in real terms?
The real-terms decline comes from a gap between borrowing costs and household incomes rather than one major event.
Mortgage rates have stayed well above the ultra-low levels that fuelled the 2020–2021 price boom, and that alone has been enough to cool demand without triggering a sharp nominal fall. Three forces are doing most of the work:
- Higher borrowing costs: The same monthly mortgage payment now buys less property than it did when rates were low, so buyers cannot stretch their budgets as far.
- Weak income growth: The usual way out of this gap, with wages catching up with prices over time, has happened more slowly than in previous cycles.
- Persistent inflation: The purchasing power of money tied up in property has fallen, even where the sale price has stayed flat or edged upwards.
David Fell, a senior analyst at Hamptons, described the effect on many sellers in comments reported by GB News: most homeowners have not seen their property’s cash value fall, but inflation has reduced previous gains, leaving prices across much of southern England below their inflation-adjusted peak.
That difference between a paper gain and a real-terms loss is why the decline can be hard for many homeowners to see.
Nominal growth vs real decline: What the England HPI actually shows
A homeowner checking the official house price index this year would see growth, not a decline. Both figures are correct because they measure different things. The UK House Price Index for England recorded a 1.8% annual increase to June 2026, taking the average property value to £293,000.
Across the UK as a whole, the average house price stood at £272,188 in June 2026, up 2.0% year-on-year and 0.1% on the month before, a slightly higher national growth rate, though still nowhere near enough to outpace inflation.
That is a genuine, unadjusted rise. It is also entirely consistent with a real-terms fall, because inflation over the same period has outpaced that 1.8% growth rate.
| Measure | What it shows | England, most recent data |
|---|---|---|
| Nominal price change | Nothing subtracted for inflation | +1.8% annual, average £293,000 |
| Real-terms change since 2021 peak | Inflation-adjusted | -£47,522 versus June 2021 peak |
Many owners see a rising average price as proof that the housing market has bounced back. But once inflation is taken into account, the current data tells a different story.
Both the nominal and real-terms figures are accurate. They simply answer different questions, while most headline reports focus on only one of them.
London vs the North: Why the same national figure hides two different markets
A single England-wide average hides two housing markets moving in very different directions.
London recorded an annual price fall of 2.5% in the latest official data, with the average property now valued at £554,000, and in real terms, prices in the capital sit roughly 23% below their 2017 peak, a decline stretching back nearly a decade.
The North West of England tells the reverse story, with annual growth of 4.7%, the strongest of any English region.
That difference matters more than the national average for anyone trying to understand what is happening in their local market. A seller in outer London is competing in a market with more homes for sale than at any point since 2010, facing buyers who have both choice and negotiating leverage.
A seller in Manchester or the wider North West is operating in a market where demand has stayed comparatively resilient, and prices are still climbing.
Stamp duty adds another layer to the split: London buyers face a materially higher proportion of purchases falling into higher stamp duty bands than buyers almost anywhere else in the country, which further dampens demand exactly where prices are already softest.
For buyers priced out of the southern market, renting or looking at social housing may be worth considering while prices settle.
Some are turning to renting or social housing while prices settle. For those considering this option, understanding how to apply for a council house can be a useful first step while continuing to save for a deposit.
Why so many England homes still aren’t selling
Nearly half of all homes listed for sale in England over the past three years failed to find a buyer, with pricing, rather than the wider economy, the main reason. Zoopla’s research found that 44% of listings over that period did not sell, with unrealistic asking prices cited as the dominant factor behind failed sales.
The gap between a well-priced home and an overpriced one is stark in practice. Homes that did not need a price reduction sold in an average of 36 days; those that did need a reduction took 127 days on average, more than three times as long.
Much of the mismatch comes from sellers basing their expectations on older market prices. The typical seller has lived in their home for around nine years, meaning their sense of its value is often based on market conditions from nearly a decade ago rather than what buyers are actually willing to pay today.
| Pricing outcome | Average days to sell |
|---|---|
| No price reduction needed | 36 days |
| Price reduction needed | 127 days |
This gap helps explain why the market can feel stuck even when transaction levels and mortgage approvals suggest that buyer demand is still there.
Is a house price crash likely in 2026?
Most forecasters do not expect a house price crash on the scale of 2008 in 2026. The general view is that the market is more likely to see a correction than a collapse. The distinction matters: a crash typically involves a sudden fall of 15–20% or more within a short window, driven by forced selling and a credit crunch.
The current national data does not show that pattern, although some parts of the market, particularly London flats, have recorded much sharper falls.
The conditions that led to the 2008 crash are largely absent today. Lending standards are far tighter than they were before the financial crisis, self-certified and high-risk mortgages have all but disappeared, and there is no sign of the mass forced selling that turned a slowdown into a collapse.
Most 2026 forecasts instead expect prices to remain broadly flat or rise modestly over the year, although individual regions and property types may continue to move differently.
| Factor | 2008 financial crisis | 2026 housing market |
|---|---|---|
| Trigger | Global banking crisis | Affordability pressure, economic uncertainty |
| Lending standards | Loosely regulated, high-risk mortgages common | Tightly regulated, strict affordability checks |
| Mortgage availability | Contracted sharply | Remains widely available |
| Scale of price falls | Significant, nationwide | Concentrated in specific areas and property types |
Some of the caution in current forecasts comes from unresolved policy questions as well as market conditions.
Ongoing uncertainty over a proposed Labour house value tax on higher-value homes sits alongside mortgage rate volatility and inflation as one of the factors keeping forecasters hedged on exactly how much growth 2026 will deliver.
Until that policy uncertainty clears, most analysts are likely to give a range of possible outcomes rather than firm predictions.
Conclusion
The England real house prices decline comes down to one simple point: nominal prices are still rising, but inflation has risen faster, leaving real values £47,522 below their June 2021 peak.
Regional differences, mortgage rates and asking prices all affect how strongly individual sellers feel that gap. The next official house price release, along with any clarity on proposed property tax changes, will be worth watching for signs of whether that gap starts to narrow.
FAQ
What caused the real-terms decline in England house prices?
Higher mortgage rates, weak wage growth and persistent inflation have all contributed since the 2021 peak. No single factor explains the full £47,522 fall on its own.
Are house prices actually falling, or just growing more slowly?
Both, depending on the measure. Nominal prices grew 1.8% annually in the latest data, while real-terms values remain well below their 2021 peak.
Is a UK house price crash likely in 2026?
A nationwide crash looks unlikely. Most forecasters expect a correction rather than a collapse because lending standards are much tighter than before 2008 and forced selling remains rare.
What’s the hardest month to sell a house?
Winter is most commonly cited, although sources differ on whether January or December is the harder month. Setting the right price and presenting the property well can have a much bigger effect on how quickly it sells.
Disclaimer: This article is for informational purposes only and does not constitute financial, legal, or professional property advice.