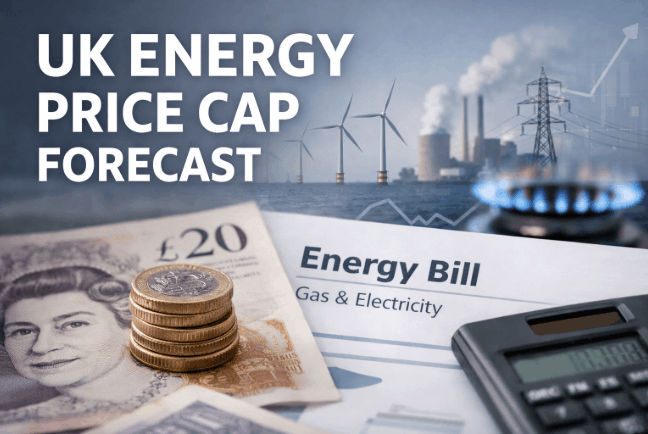
UK Energy Price Cap Forecast 2026: Quarter-by-Quarter Predictions and When to Fix Your Rate
The UK energy price cap forecast for 2026 signals rising bills across three consecutive quarters following April’s reduction. Cornwall Insight’s final prediction puts the July cap at approximately £1,850 for a typical household, a £209 increase on the current £1,641. Further increases are forecast through October 2026 and into early 2027.
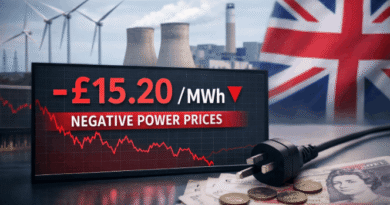
Wholesale gas prices roughly doubled between February and May 2026 following the disruption of Middle East energy supply routes, firmly reversing the downward trend that delivered April’s lower bills.
The surge has reshaped the outlook heading into the second half of 2026, and the fix-or-stay decision has become the most consequential financial choice available to households right now.
Key Takeaways
- The current energy price cap is £1,641 for a typical dual-fuel household (April–June 2026), confirmed by Ofgem, a £117 reduction on Q1 2026 that the Q3 forecast reverses entirely.
- Cornwall Insight’s final July 2026 forecast is approximately £1,850, a 13% rise, with further increases forecast in October 2026 (~£1,929) and January 2027 (~£1,941).
- The primary driver is the wholesale gas price surge following geopolitical disruption in the Middle East from late February 2026, with UK import dependence amplifying the impact on domestic bills.
- Whether fixing a tariff is worthwhile depends on the rate offered, the fix duration, and personal circumstances, and all three need weighing carefully before committing to anything.
What the UK Energy Price Cap Is and What It Costs a Typical Household Now?
The energy price cap does not limit the total amount a household pays for energy, it caps the unit rate and standing charge that suppliers can charge customers on a standard variable tariff. According to Ofgem, the cap for Q2 2026 (April to June) is set at £1,641 for a typical dual-fuel household paying by direct debit.
That figure is built on Ofgem’s Typical Domestic Consumption Values (TDCVs), a standardised benchmark assuming 2,700kWh of electricity and 11,500kWh of gas consumed per year.
A household using more than those amounts pays proportionally more; one using less pays proportionally less. The headline cap figure reflects the rate ceiling applied to the benchmark, not a fixed annual spend.
Two households with different usage habits will end up paying very different amounts, whatever the headline figure says.
The cap reviews quarterly in January, April, July, and October, meaning a household on a standard variable tariff sees its protected rate change four times a year.
Each review is based on wholesale market data from the preceding observation window, which is why bills can move sharply between quarters when market conditions shift.
Despite April’s reduction, typical bills remain roughly 35% above pre-2021 levels, a lasting consequence of the wider cost of living crisis. The cap covers England, Wales and Scotland; Northern Ireland operates under a separate regulatory framework.

UK Energy Price Cap Forecast 2026 to 2027: Quarter-by-Quarter Predictions
Bills are forecast to rise across three consecutive quarters from July 2026 before tentative stabilisation appears in early 2027. The latest predictions from the leading independent and supplier forecasting services are shown below.
UK Energy Price Cap Forecast: Quarter-by-Quarter 2026–2027
| Quarter | Cap Figure (Current TDCVs) | Change vs Previous Quarter | Forecaster Range | Confidence Level |
|---|---|---|---|---|
| Q2 Apr–Jun 2026 | £1,641 | −£117 | Confirmed by Ofgem | Confirmed |
| Q3 Jul–Sep 2026 | ~£1,850 | +£209 | £1,821–£1,855 | High |
| Q4 Oct–Dec 2026 | ~£1,929 | +£79 | £1,923–£1,945 | Medium |
| Q1 Jan–Mar 2027 | ~£1,941 | +£12 | £1,935–£1,955 | Low |
| Q2 Apr–Jun 2027 | ~£1,922 | −£19 | £1,905–£1,935 | Very low |
Sources: Cornwall Insight final forecast (22 May 2026), EDF Energy, E.ON Next, Sainsbury’s Energy. All figures apply to a typical dual-fuel household on a standard variable tariff paying by direct debit, using current Ofgem TDCVs.
The UK energy price cap is forecast to reach approximately £1,850 in July 2026, rising to around £1,929 in October 2026 and approximately £1,941 in January 2027.
These figures apply to a typical dual-fuel household on a standard variable tariff paying by direct debit, calculated using current Ofgem Typical Domestic Consumption Values.
Confidence in forecasts beyond Q3 is materially lower, wholesale prices remain sensitive to how the Middle East supply disruption develops from here.
The forecaster range for July, £1,821 to £1,855, reflects genuine uncertainty about how far wholesale prices moderate before the observation window closes. Octopus Energy sits at the lower end of that range; ScottishPower and British Gas at the higher.
A narrow range signals strong market consensus; the wider spreads for Q4 and Q1 2027 reflect how much less is known about where wholesale prices will sit when those quarters arrive.
What Will the Energy Price Cap Be in July 2026?
The July 2026 energy price cap is forecast at approximately £1,850 for a typical household under current Ofgem TDCVs. Cornwall Insight’s final prediction, published 22 May 2026 following the close of the observation window on 18 May, came in at £1,850.13.
EDF Energy forecast £1,847 and E.ON Next £1,849, placing all three leading forecasters within £4 of each other, a degree of convergence that reflects the completeness of the window data at that stage.
Ofgem is consulting on revising TDCVs downward from July 2026, reducing assumed electricity use from 2,700kWh to 2,500kWh and gas from 11,500kWh to 9,500kWh. Under those proposed values the forecast falls to £1,666, a figure that will appear in some media headlines.
It does not mean energy bills are lower than the current cap. It means the benchmark household is smaller. Unit rates are rising regardless of which consumption standard is applied, and any quarter-on-quarter comparison must verify that both figures use the same TDCV basis to be meaningful.
Check ofgem.gov.uk for the confirmed Q3 figure following the official announcement expected on 27 May 2026.

What Is Driving UK Energy Prices Up in 2026?
The surge in wholesale gas prices accounts for the bulk of the July cap increase. Five factors have driven it since late February 2026:
- Middle East supply disruption: US and Israeli air strikes on Iranian energy infrastructure on 28 February 2026 triggered immediate volatility across European gas markets. Sustained uncertainty around the Strait of Hormuz, a critical transit corridor for global LNG, kept prices elevated throughout the full Ofgem observation window and built a significant risk premium into European forward pricing.
- Wholesale gas prices roughly doubling: UK wholesale gas prices approximately doubled from pre-February 2026 levels in the weeks following the initial strikes. That spike was the single largest input into the Ofgem Q3 observation window and is the primary reason the cap rises by £209 from Q2.
- UK import dependence: Declining North Sea domestic gas production has steadily increased the UK’s reliance on imported LNG and Norwegian pipeline gas. That structural dependence amplifies the domestic impact of any international supply shock, what might have been a contained price event in earlier years carries far greater consequence for UK household bills now.
- Slower-than-expected storage refill: European gas storage levels entering the 2026 injection season were below the five-year average following a colder Q1. Lower storage reduces the buffer available to moderate price spikes and has kept market sentiment cautious across the spring.
- Government partial offset: The 2025 Autumn Budget removed the Energy Company Obligation levy from bills and shifted green levies to general taxation, reducing the average household bill by approximately £150 annually from April 2026. Without that measure, the Q3 increase would be materially steeper.
The Bank of England held its base rate at 3.75% at its April 2026 Monetary Policy Committee meeting, citing energy prices as a key driver of inflation projections of 3.6–3.7% by the end of 2026.
Elevated energy inflation is making rate cuts harder to justify, with the knock-on effects running through to the wider UK interest rate forecast. Mortgage and borrowing costs will stay higher for longer as a result.
Why Energy Price Cap Forecasts Change?
Every UK energy price cap forecast carries built-in uncertainty, each prediction is published before Ofgem’s data collection period has fully closed.
This is what explains why Cornwall Insight’s March figure of £1,973 and its final May figure of £1,850 both describe the same quarter yet sit £123 apart, and why that gap is not an error.
Ofgem calculates each quarterly cap using a defined observation window: a set period during which wholesale gas and electricity market prices are tracked and recorded. The July 2026 cap used prices observed from 18 February to 18 May 2026.
Any forecast published before 18 May was working from an incomplete dataset. Cornwall Insight’s early March forecast captured just two weeks of post-Iran-strike data, at the point when wholesale prices had spiked most sharply and had not yet begun to moderate.
That early figure was not wrong, it was a probability-weighted estimate of where wholesale prices would average across the full window, given the data available at that moment. By 18 May, three complete months of data had entered the calculation and the final figure settled at £1,850.
The Department for Energy Security and Net Zero described the March figure as highly speculative, technically accurate, but the same caveat applies to every early-period forecast for any quarter, regardless of the forecaster.
A forecast published in late June for the October 2026 cap carries more uncertainty than one published after the late July window closes.
The closer to the window close date a forecast is published, the more reliable the figure. When comparing predictions across different sources and dates, the publication date relative to the window matters as much as the number itself.
Will Energy Prices Go Up or Down in 2026?
Energy prices are forecast to rise through the rest of 2026, the April reduction has already been cancelled out across every leading forecast. The late-2025 fall in wholesale costs that drove the Q2 cut from £1,758 to £1,641 has been undone by the Middle East supply disruption that began in February and has yet to ease.
The Q3 rise of approximately £209 is the largest single-quarter jump in the forecast horizon, driven by the full weight of the wholesale price spike entering the observation window. Q4 adds a further ~£79.
The rate of increase then slows sharply into early 2027, suggesting the market is pricing in some eventual moderation, but at a level that leaves bills roughly £300 above the current Q2 cap for the foreseeable future.
A material price fall before Q1 2027 would need both a sustained easing of Middle East supply disruption and a mild continental winter to keep European demand in check.
Common Myths About the UK Energy Price Cap And What Is Actually True
| Myth | Reality |
|---|---|
| The price cap limits the total amount you pay for energy | The cap sets a maximum unit rate and standing charge, total bills depend entirely on how much energy a household actually uses |
| The July 2026 cap will be £1,666 | £1,666 applies only under Ofgem’s proposed new TDCVs. Under current TDCVs, the basis for all historical comparisons, the forecast is approximately £1,850 |
| Cornwall Insight’s March forecast of £1,973 was wrong | It was accurate for that point in the observation window and revised to £1,850 as more wholesale data entered the calculation, not due to a methodology error |
| Fixing a tariff now means paying above the cap level | Whether fixing costs more depends entirely on the rate offered and the forecast trajectory, a fix priced below forecast cap levels represents a saving |
| The price cap protects all energy customers | The cap only covers standard variable tariff customers. Those on active fixed contracts are outside its scope until their deal expires |
| Northern Ireland is covered by the Ofgem price cap | The Ofgem cap applies to England, Wales and Scotland only, Northern Ireland has a separate energy regulatory framework |
Should You Fix Your Energy Tariff in 2026?
Fixing a tariff could meaningfully reduce exposure to the forecast price rises, but the right decision depends on the rate available, the fix duration, and personal circumstances. Work through these four steps before signing anything.
Step 1: Confirm which tariff you are currently on. Check whether you are on a standard variable tariff, subject to the quarterly price cap, or an active fixed deal. If a fixed contract is already running, no action is needed until it expires. Switching away from an active deal before it ends typically incurs an exit fee, so factor that cost into any comparison.
Step 2: Compare the offered fix rate against the forecast cap trajectory. If a 12-month fixed tariff is priced below the combined average of the Q3 and Q4 2026 forecast cap levels, approximately £1,889 based on current central forecasts, it warrants serious consideration.
MoneySavingExpert’s weekly-updated aggregated forecast table consolidates predictions from EDF Energy, British Gas, and E.ON Next and is a reliable reference for live rate comparisons. Rates and forecasts both update regularly, so check on the day you plan to switch.
Step 3: Assess the fix duration carefully. A 1-year fix covers Q3 and Q4 2026, the two quarters of highest forecast certainty, where the cap is expected to sit materially above its current level. A 2-year fix extends through Q1 and Q2 2027, where forecaster confidence is significantly lower.
If Middle East supply conditions ease or European storage recovers faster than expected, the cap could fall below current fix-rate levels by early 2027. Shorter fixes carry less duration risk.
Step 4: Factor in personal and financial circumstances. If financial pressure makes a fixed commitment difficult to sustain, explore available support options before signing any contract.
The DWP benefit review 2026/27 covers entitlements, including Warm Home Discount eligibility and Cold Weather Payments, that may be relevant to households under sustained energy cost pressure. Getting that support in place first can shift the maths on whether a fixed deal is the right call at all.

Conclusion
The UK energy price cap forecast points clearly upward through the remainder of 2026, with the April reduction already fully reversed in every leading prediction. One conflict circulating in current coverage deserves resolving: headlines citing a July cap of £1,666 reflect Ofgem’s proposed smaller benchmark household, not a confirmed fall in unit costs.
Rates are rising regardless of which consumption standard applies, and any quarter-on-quarter comparison must verify that both figures share the same TDCV basis.
The UK energy price cap forecast means higher bills for most households through 2026, making it the most pressing financial decision most households will face before the year is out.
FAQ
Does the energy price cap apply to prepayment meter customers?
Yes. Since April 2023, Ofgem has required suppliers to charge prepayment meter customers the same unit rates and standing charges as direct debit customers. Previously, prepayment users faced a higher rate. That equalisation remains in force across all 2026 cap periods, regardless of meter type or payment method used.
What is the energy price cap unit rate per kWh in 2026?
Unit rates under the cap vary by region and payment method. Cornwall Insight’s final July 2026 forecast projects electricity at 26.03p per kWh and gas at 7.16p per kWh under current TDCVs. For confirmed current unit rates broken down by region and tariff type, consult the dedicated unit rates section at ofgem.gov.uk directly.
Is UK electricity among the most expensive in the world?
The UK has among the highest electricity unit rates in Europe, largely due to network charges and policy costs embedded in the unit rate. Direct global comparisons are complicated by differing subsidy structures, taxation levels, and purchasing power standards across markets. The Ofgem price cap exists to limit what suppliers can charge domestic customers during periods of elevated wholesale volatility.
When will Ofgem announce the October 2026 price cap?
Ofgem typically announces each quarterly cap approximately six weeks before it takes effect. The Q4 October 2026 cap announcement is expected in mid-to-late August 2026. Cornwall Insight will normally publish an early Q4 forecast in late June, with a final prediction following the close of the late July observation window.
What is the difference between a fixed tariff and the price cap?
The price cap sets the maximum unit rate and standing charge for standard variable tariff customers, reviewed quarterly by Ofgem. A fixed tariff locks a specific rate for a defined period, typically 12 or 24 months, and is unaffected by quarterly cap changes. Fixed customers avoid cap increases but also miss any reductions that occur during their contract term.
Does the energy price cap cover Northern Ireland?
No. The Ofgem energy price cap applies to England, Wales and Scotland only. Retail energy prices in Northern Ireland are regulated separately by the Utility Regulator Northern Ireland. Households in Northern Ireland should consult the Utility Regulator’s website for information on applicable tariff protection and consumer rights.
Can energy bills fall below the price cap headline figure?
Yes. The cap sets a ceiling on unit rates, not a minimum spend. Households that reduce consumption through efficiency improvements, smart meter installation, or behavioural changes can pay well below the typical headline figure. The £1,641 benchmark, and any forecast cap figure, assumes full TDCVs of 2,700kWh electricity and 11,500kWh gas annually.
Where can households find the most reliable energy price cap predictions?
The most authoritative sources are Cornwall Insight’s Default Tariff Cap forecast page, updated after each observation window closes; MoneySavingExpert’s weekly-updated aggregated forecast table; and Ofgem’s official cap announcements at ofgem.gov.uk. EDF Energy, E.ON Next, and Octopus Energy also publish weekly updated estimates reflecting the latest wholesale market movements.
Information verified against Ofgem official announcements, Cornwall Insight’s final Default Tariff Cap forecast (22 May 2026), and supplier forecasting services including EDF Energy, E.ON Next, and Sainsbury’s Energy. Check ofgem.gov.uk for the most current confirmed cap figures, unit rates, and official Q3 2026 announcement.