Average Pension Pot UK By Age, Gender And Region: Monthly Income And Good Pot Levels 2026
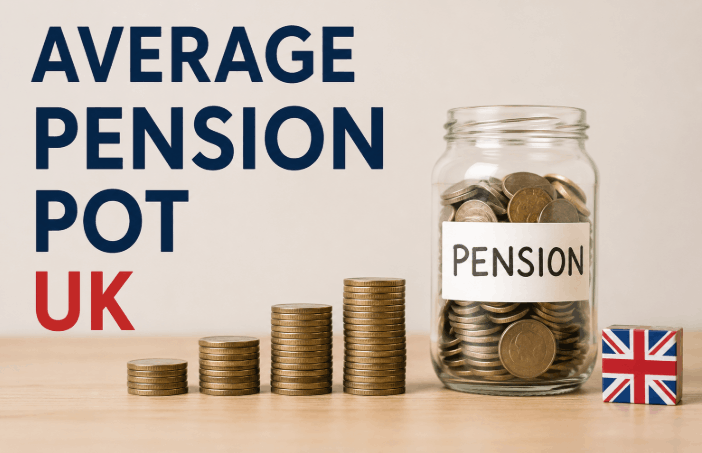
The average pension pot in the UK stands at a median of £57,500 among adults who hold pension savings, according to Office for National Statistics data covering April 2020 to March 2022 and published in January 2025. Including adults with no pension savings, the overall median falls to £19,700.
Key Takeaways
- The median UK pension pot is £57,500 among adults with pension savings, and £19,700 across all adults, per ONS data published in January 2025.
- The full new State Pension pays £241.30 a week, £12,574 a year, for 2026/27 following the April 2026 uprate.
- A moderate retirement lifestyle for a single person requires an annual income of roughly £32,700, according to the Pensions and Lifetime Savings Association’s Retirement Living Standards.
What Counts as the Average Pension Pot in the UK?
The figure quoted as the average UK pension pot depends on which measure is being used. PensionBee’s customer data, drawn from a sample of 285,287 savers as of June 2025, puts the average pot at £21,875. This is a mean based on its own customer base, not the wider UK population.
The Office for National Statistics instead reports a median of £57,500 among adults who hold pension savings. This median falls to £19,700 once adults with no pension wealth at all are included in the calculation.
This is not a case of one figure being wrong. A mean can be pulled upward by a relatively small number of very large pots. A median reflects the midpoint saver, which is why it is generally treated as the more representative figure for population level comparisons.
The ONS also found that 70% of adults aged 16 and over hold at least one pension pot. Active contribution has risen from 34% of working age adults a decade ago to 44% by March 2022, a trend linked to automatic enrolment under the Pensions Act 2008.
- Widely circulated claim: Several finance sites state that the average UK pension pot is £32,700, attributing the figure to the ONS.
- Correct position: £32,700 is not an ONS pension wealth figure. It is the Pensions and Lifetime Savings Association’s moderate retirement lifestyle income benchmark for a single person, an annual spending target rather than a pot size.
Source: Pensions and Lifetime Savings Association Retirement Living Standards, with Loughborough University.
Each figure measures something different, and keeping that distinction in mind stops the three numbers being read as interchangeable.

Average Pension Pot UK by Age: A Full Breakdown
Pension savings rise steadily through a working life and peak just before most people retire. The average pension pot at 65 in the UK reaches its highest point here, at £145,900.
The table below shows median private pension wealth for each age band, based on the ONS Wealth and Assets Survey covering April 2020 to March 2022.
| Age group | Median private pension savings |
|---|---|
| 16 to 24 | £5,500 |
| 25 to 34 | £18,800 |
| 35 to 44 | £39,500 |
| 45 to 54 | £80,000 |
| 55 to 64 | £137,800 |
| 65 to 74 | £145,900 |
| 75 and over | £59,700 |
Pension savings do not grow at an even pace between each age band. Savings roughly triple between the 25 to 34 and 35 to 44 bands, then double again by the 55 to 64 band, reflecting both rising salaries and decades of compounding on earlier contributions.
Wealth falls after age 74, reflecting retirees drawing an income from their pot rather than any drop in saving habits.
Average Pension Pot at 30, 40, 55 and 65: What Changes at Each Milestone?
Where a saver sits within the average pension pot UK by age table matters more than the national average alone.
- At 30, typical pension savings sit close to £18,800, the midpoint of the 25 to 34 band. This is usually the earliest point at which auto enrolment contributions have had several years to compound.
- At 40, the typical pot sits around £39,500. Separate PensionBee data splits this age band by gender, showing roughly £26,482 for men and £20,141 for women.
- At 55, savers typically hold between £80,000 and £137,800, depending on where they sit within the wide 45 to 64 range. The Financial Conduct Authority separately reported an average of £107,300 for those aged 55 and over in 2022. Age 55 is also the earliest point pension savings can normally be accessed, rising to 57 from 2028.
- At 60, savings often sit close to the 55 to 64 median of £137,800. This is also the age band where the gender pension gap widens most sharply, reaching 44% for those aged 50 and over.
- At 65, the typical pot peaks at £145,900, the highest median figure recorded across any age group, before beginning to fall as retirees start drawing an income.
A pot below these figures can still be brought closer in line, and consolidating older workplace pensions into a single scheme is often the quickest way to start.
What Is a Good Pension Pot? The PLSA Retirement Living Standards
A good pension pot is one that funds the annual income you actually want, not simply one that matches a national average.
| Lifestyle standard | Annual income needed, single person |
|---|---|
| Minimum | £13,900 |
| Moderate | £32,700 |
| Comfortable | £45,400 |
Source: Pensions and Lifetime Savings Association Retirement Living Standards, calculated with Loughborough University, updated June 2026.
Using a common 4% sustainable withdrawal rate and the current full State Pension of £12,574 a year, a moderate lifestyle needs a private pension pot of roughly £503,000. A comfortable lifestyle needs closer to £821,000 by the same method.
These figures assume the State Pension covers part of the target income. Anyone not entitled to the full rate, due to gaps in National Insurance contributions, would need a correspondingly larger private pot to reach the same lifestyle standard.

Average Pension UK Per Month: What Your Pot Actually Pays?
A pension pot rarely converts into a clean monthly figure on its own, so a short calculation is needed first.
- Take your total pot value and apply a sustainable withdrawal rate, typically around 4% a year, to estimate your annual private income.
- Add your State Pension entitlement, currently £241.30 a week for those receiving the full new rate in 2026/27.
- Divide the combined annual total by 12 to see your actual monthly retirement income.
For someone with the median 65 to 74 pot of £145,900, a 4% withdrawal generates about £486 a month before the State Pension is added. Total monthly income reaches roughly £1,534 once the State Pension is included.
A larger pot of £250,000 at the same withdrawal rate generates about £833 a month privately. Combined with a full State Pension, that reaches approximately £1,881 a month.
A withdrawal rate set too high in the early years of retirement is one of the main drivers behind the pension pot emptying rise, which is why a pot is worth checking against realistic life expectancy before a fixed monthly figure is settled on.
How Much Pension Pot Do You Need for £2,000 a Month?
Using the same monthly income method, hitting a £2,000 monthly income requires a private pension pot of roughly £286,000 to £326,000, on top of a full State Pension.
A £2,000 monthly income equals £24,000 a year. Subtracting the current full State Pension of £12,574 leaves £11,426 a year to be generated from private savings. At a 4% withdrawal rate this requires a pot of about £286,000, rising to roughly £326,000 at a more cautious 3.5% rate.
Research by Legal and General and the Happiness Research Institute, based on a study of 3,000 UK retirees, found that those with a monthly income around £1,700, equivalent to a pot of roughly £221,858 including the State Pension, reported the highest life satisfaction of any income band studied. Satisfaction gains levelled off once income passed about £2,000 a month.

Regional and Gender Differences in UK Pension Pots
Pension pots vary sharply by both gender and region across the UK, and the two factors often compound each other.
The gender pension gap by age
The overall UK gender pension gap is 37%, with men holding an average pension pot of £25,652 compared with £16,169 for women. This gap widens consistently as savers get older, rather than staying fixed at one level.
| Age band | Average pot, men | Average pot, women | Gender gap |
|---|---|---|---|
| Under 30 | £4,009 | £3,481 | 13% |
| 30 to 39 | £11,870 | £9,451 | 20% |
| 40 to 49 | £26,482 | £20,141 | 24% |
| 50 and over | £54,512 | £30,644 | 44% |
Source: PensionBee, The UK Pension Landscape, July 2025.
Regional variation
- The South East holds the highest average pension pots in England, at £27,727, followed by Greater London at £25,838.
- Northern Ireland has the lowest average pension pot of any UK region, at £15,811, followed by the North West at £17,082.
- The gender gap itself varies by region, running as high as 43% in Northern Ireland but falling to 29% in Greater London, the narrowest gap recorded anywhere in the UK.
Pay differences, working hours and career breaks each contribute to this gap, rather than any one factor on its own.
How to Check and Boost Your Pension Pot?
Checking your pension pot takes only a few minutes, yet a survey by The People’s Pension found that 32% of UK adults do not know the current value of their retirement savings.
- Request a State Pension statement online, by phone or by post, if you are over 16 and more than 30 days from State Pension age.
- Use the government’s free Pension Tracing Service to locate workplace pensions from previous employers.
- Ask your current provider for an annual benefit statement showing your projected pot value at retirement.
Consolidate old pension pots
The average UK worker holds around ten to twelve jobs across a career, often leaving several separate workplace pensions behind. Combining these into a single scheme makes total savings easier to track and can reduce overlapping fees.
Increase your contributions
Raising your monthly contribution, even by a small amount, benefits from HM Revenue and Customs tax relief and compound growth over time. MoneyHelper and Pension Wise both offer free, impartial guidance for anyone weighing up a change to their contribution rate.

Conclusion
Average pension pot UK figures shift considerably by age, gender and region, so a single national number rarely reflects an individual saver’s position. Measuring personal savings against the ONS median, the PLSA living standards and a realistic monthly income figure gives a far more useful benchmark than any single headline number
Average pension pot UK figures mean context matters more than comparison for savers planning retirement in 2026.
FAQ
Is 200k a good pension pot in the UK?
Yes, for many single retirees. A £200,000 pot roughly matches the pot needed for a moderate retirement lifestyle when combined with the full State Pension, though comfort still depends on your own target income.
Is 500k a good pension pot at 55?
£500,000 comfortably clears the pot typically needed for a moderate lifestyle and sits close to the comfortable lifestyle threshold, though at 55, this pot cannot usually be accessed until age 57 from 2028.
What is a good pension pot at 60 UK?
A good pension pot at 60 sits above the age 55 to 64 median of £137,800. Reaching closer to £330,000 alongside the State Pension supports a moderate retirement lifestyle without a shortfall.
Is 1000000 a good pension pot in the UK?
A £1,000,000 pot goes well beyond the amount needed for even a comfortable retirement lifestyle, generating an income above the PLSA’s highest published living standard.
How do you check your average pension pot in the UK?
Checking your average pension pot in the UK starts with a State Pension statement and provider benefit statements. The free Pension Tracing Service can locate pensions from past employers if any records have been lost.
Disclaimer: This article is for general information only and does not constitute financial advice.




Pingback: Retirement Age UK for Male: Exact Dates, Payouts